Clone-and-run reference implementation · version 4.2.1 · Apache-2.0

Three federal studies.
The join is the component.

The FAIR Data Demo takes three real federal releases, the CDC's NHANES 2017-2018 and BRFSS 2022 surveys and the CMS DE-SynPUF Medicare claims sample, and models each on one published component library. Where two studies mean the same thing, their models compose the same component, so a cross-study question is a join on the component, not a mapping table someone reconciles later. Run it on your own machine, ask which components the studies share, and get 20 of them, 8 carried by all three, counted from the records in the store.

Nothing to sign up for and nothing hosted. The source files are free federal downloads; after the first pull the stack runs with no outbound network.

github.com/SemanticDataCharter/FAIR_Data_Demo The seven models in DCAT-US 3.0 sdcvalidator on PyPI 3 federal studies 7 models 84,352 records 20 shared components

Two ways in

For the person who funds the data, and the person who has to harmonize it

If you sign for research data

Fifteen minutes, no background assumed

Open the console and ask its first question: which components do records of more than one study carry? The answer is computed from the store with the query printed beside it: gender, race and ethnicity, age, smoking status, veteran status and the chronic conditions, each the same published component in every study that measures it.

Then read what the demo says it does not show. Medications do not join across studies, because neither source ships RxNorm, and the walk-through shows the gap instead of staging the join. A demonstration that names its limits is the one you can believe.

What to look at, and what to ask

If you build data pipelines

The curation is code, and it is in the repo

build/author.py writes the 266 component records the studies share, each with its source, its definition and its links to LOINC, SNOMED CT and the agencies' codebooks. Every one passed a human review, recorded in review/fair.csv, before it loaded. The seven models and the seven applications SDCStudio generated are committed exactly as downloaded, under sdcstudio_downloads/.

The generators name each fact by its label path in the published model; the template engine fills the model's own instance and refuses a value of a shape the schema does not allow. Every record is validated against its XSD 1.1 schema, stored once, and projected into GraphDB as its own named graph.

For the people who run it

See it

Seven models, one knowledge graph

localhost:18100/demo/ — the dashboard
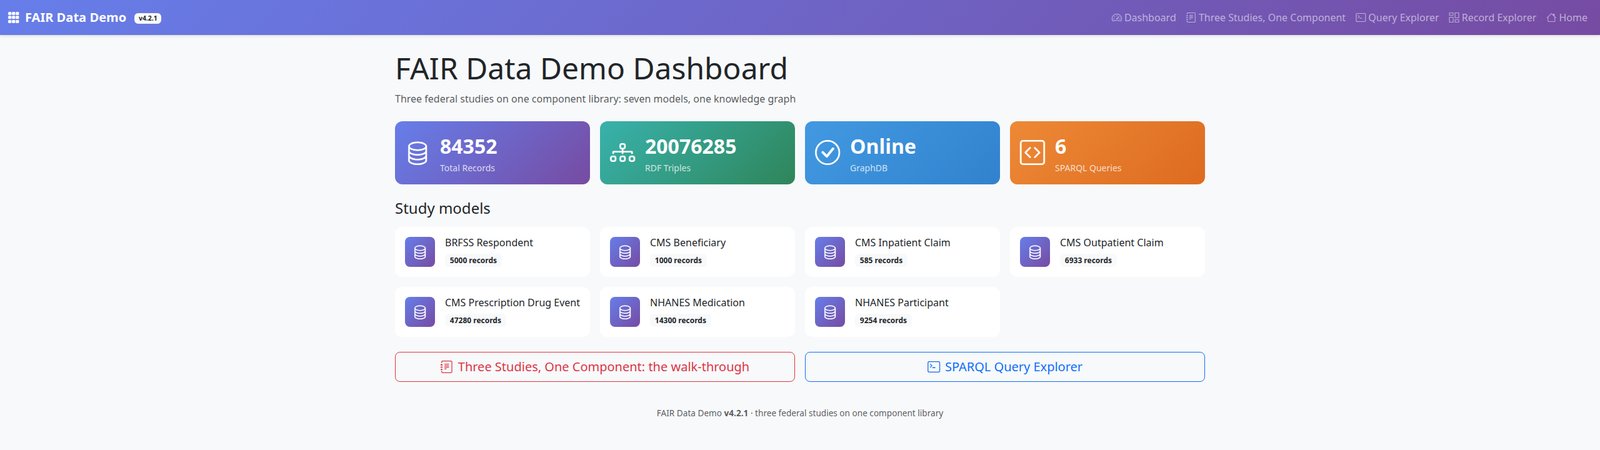
The FAIR Data Demo dashboard: 84,352 records, about 20 million RDF triples, GraphDB online, six SPARQL queries, and the seven study models with their record counts
The dashboard after make demo: seven study models from three federal releases, 84,352 Governed Data Records, one named graph each. From here, the walk-through "Three Studies, One Component" runs six beats, each answered by a saved query, each with a graph where every component two studies compose is drawn as the node their records meet at.

Run it

Download three files, then one command

You need Docker or Podman with the compose plugin, about 10 GB of free RAM, Python 3.12 on the host for data generation, and the three federal source files, free to download without registration. source_data/README.md lists each one and where to get it.

Generation takes about three minutes. Loading is the cost: every instance is validated against its XSD 1.1 schema, written to PostgreSQL and projected into GraphDB. The default sampled dataset loads in about 107 minutes on a laptop.

The generators are seeded, so every run on every machine produces the same records from the same rows. Only the record timestamps move.

git clone https://github.com/SemanticDataCharter/FAIR_Data_Demo.git cd FAIR_Data_Demo git checkout v4.2.1 # download the source files into source_data/, then python3 -m pip install pyreadstat pandas python3 scripts/convert_xpt_to_csv.py make demo

Then open

http://localhost:18100/console/  the record console. Start here.

http://localhost:18100/demo/  the dashboard, the walk-through, and the query explorer.

A correct run shows these numbers on the console front page:

Records loaded84,352
Named graphs in GraphDB84,352
Models7
Records stating an absence0

What is inside

Six things, and every one of them is checkable

Real federal data

Every record traces to a row

Each record is generated from a row of the federal file and carries its provenance: the activity that made it, the federal file by URL and release as the entity it used, the pipeline as the agent. The record's subject is the study's own participant identifier. NHANES and BRFSS are real, de-identified releases; DE-SynPUF is CMS's synthetic public file.

The join is the component

Twenty shared, eight by all three

Where two studies mean the same thing they compose the same published component: smoking status on one LOINC answer set, twenty-one chronic conditions each with its SNOMED CT subject, gender, race and ethnicity, age. Counted from the store by the console's first question, never from a README.

Absence, counted

A 9 is never averaged as an answer

NHANES codes a refusal as 7 and a don't-know as 9, BRFSS as 7 and 9 or 77 and 99, and CMS leaves the field blank. The generators leave those out of the record and count them, so no refusal parses downstream as a real value.

Coded as recorded

The agencies' codes stay beside every harmonized value

ICD-9-CM, HCPCS and NDC for the claims, the survey weights, strata and identifiers, kept as the study recorded them. Where the published lists don't nest, as with education and income, the model carries the agency's code only, and says so.

Three Studies, One Component

Six beats, one saved query each

The shared-component audit, smoking status across two questionnaires, blood pressure measured and not asked, conditions and the basis for each, the medication join that does not exist and why, demographics side by side. Each with a table and a graph.

Described for catalogs

The same models, projected to federal and FAIR metadata

The seven models are written as a DCAT-US 3.0 catalog with each schema as its data dictionary, validated with GSA's own schema, and the NHANES Participant model as a CODATA CDIF description, checked with CDIF's validators. One model, every catalog a projection.
What the first build taught

The join across studies is a modeling decision a person makes

1

An agent couldn't find it

The first build ran agents over the same files. The federal metadata was too thin to say two columns measured the same thing, so each study minted its own components and shared none.

2

A reviewed record could

This build makes each shared concept once, as a reviewed component record, and every study that measures it composes the result.

3

Nothing anyone downloaded broke

The first build's 976 components stay published and resolvable, retired with a reason naming the successor. Each new model records what it revises.

These studies are public. Your data is not.

The demo proves the machinery on three federal releases anyone can download. The 30-Day Audit runs the same question against your own studies or registries. And if the demo earned your time, a star on the repository tells the next engineer it is worth theirs.

Found something wrong, or something missing? Open an issue. The repo is Apache-2.0 and the models are in it, unmodified.